UNITED STATES
SECURITIES AND EXCHANGE COMMISSION
Washington, D.C. 20549
_______________________________________________________________________________
FORM
CURRENT REPORT
Pursuant to Section 13 or 15(d) of the Securities Exchange Act of 1934
Date of Report (Date of earliest event reported):
_______________________________________________________________________________
(Exact name of registrant as specified in its charter)
(Address of principal executive offices) | (Zip Code) |
Registrant’s telephone number, including area code: (
_______________________________________________________________________________
N/A
(Former name or former address, if changed since last report.)
Check the appropriate box below if the Form 8-K filing is intended to simultaneously satisfy the filing obligation of the registrant under any of the following provisions (see General Instruction A.2. below):
Indicate by check mark whether the registrant is an emerging growth company as defined in Rule 405 of the Securities Act of 1933 (§230.405 of this chapter) or Rule 12b-2 of the Securities Exchange Act of 1934 (§240.12b-2 of this chapter).
Emerging growth company
If an emerging growth company, indicate by check mark if the registrant has elected not to use the extended transition period for complying with any new or revised financial accounting standards provided pursuant to Section 13(a) of the Exchange Act. ☐
Securities registered pursuant to Section 12(b) of the Act:
Item 2.02Results of Operations and Financial Condition.
On November 1, 2022, Safehold Inc. issued an earnings release and made available on its website an earnings presentation for the quarter ended September 30, 2022. A copy of the earnings release and earnings presentation are attached as Exhibit 99.1 and Exhibit 99.2, respectively, hereto and incorporated herein by reference.
The information in this Current Report, including the exhibits hereto, is being furnished and shall not be deemed “filed” for purposes of Section 18 of the Securities Exchange Act of 1934, as amended, or otherwise subject to the liabilities of that Section. The information in this Current Report shall not be incorporated by reference into any registration statement or other document pursuant to the Securities Act of 1933, as amended, unless it is specifically incorporated by reference therein.
Item 7.01Regulation FD Disclosure.
On November 1, 2022, Safehold Inc. made available on its website an earnings presentation for the quarter ended September 30, 2022. A copy of the earnings presentation is attached as Exhibit 99.2 hereto and incorporated by reference.
The earnings presentation, including Exhibit 99.2 hereto, is being furnished and shall not be deemed “filed” for purposes of Section 18 of the Securities Exchange Act of 1934, as amended, or otherwise subject to the liabilities of that Section. The information in this Current Report shall not be incorporated by reference into any registration statement or other document pursuant to the Securities Act of 1933, as amended, unless it is specifically incorporated by reference therein.
Item 9.01Financial Statements and Exhibits.
Exhibit 99.1Earnings Release.
Exhibit 99.2Earnings Presentation.
Exhibit 104Inline XBRL for the cover page of this Current Report on Form 8-K.
Exhibit 99.1
Press Release
Safehold Reports Third Quarter 2022 Results
NEW YORK, November 1, 2022
Safehold Inc. (NYSE: SAFE) reported results for the third quarter 2022.
SAFE published a presentation detailing these results which can be found on its website, www.safeholdinc.com in the “Investor Relations” section.
Highlights from the earnings announcement include:
| ¾ | Q3‘22 earnings per share were $1.06, a 182% increase year-over-year |
| ¾ | Q3‘22 revenue was $71.7 million, a 52% increase year-over-year |
| ¾ | Closed $284 million1 of new originations in Q3’22, bringing total aggregate portfolio to $6.1 billion |
| ¾ | Generated a $46.4 million net gain in Q3‘22 from the sale of one ground lease |
| ¾ | UCA grew by an estimated $597 million in Q3‘22, bringing total UCA to an estimated $10.5 billion |
“Safehold reported steady progress during the third quarter with over $280 million of new originations, growing the portfolio to $6.1 billion,” said Jay Sugarman, Chairman and Chief Executive Officer. “The sale of an existing ground lease also helped highlight the potential value embedded in our portfolio and in Caret.”
1 Investments in Q3’22 include $29m of new forward commitments that have not yet been funded. Such funding commitments are subject to certain conditions. There can be no assurance that Safehold will complete these transactions.
1114 Avenue of the Americas
New York, NY 10036
T 212.930.9400
E investors@safeholdinc.com
The Company will host an earnings conference call reviewing this presentation beginning at 10:00 a.m. ET. This conference call will be broadcast live and can be accessed by all interested parties through Safehold's website and by using the dial-in information listed below:
Dial-In: | 888.506.0062 |
International: | 973.528.0011 |
Access Code: | 432150 |
A replay of the call will be archived on the Company’s website. Alternatively, the replay can be accessed via dial-in from 2:00 p.m. ET on November 1, 2022 through 12:00 a.m. ET on November 15, 2022 by calling:
Replay: | 877.481.4010 |
International: | 919.882.2331 |
Access Code: | 46957 |
●●●
About Safehold:
Safehold Inc. (NYSE: SAFE) is revolutionizing real estate ownership by providing a new and better way for owners to unlock the value of the land beneath their buildings. Having created the modern ground lease industry in 2017, Safehold continues to help owners of high quality multifamily, office, industrial, hospitality, student housing, life science and mixed-use properties generate higher returns with less risk. The Company, which is taxed as a real estate investment trust (REIT) and is managed by its largest shareholder, iStar Inc., seeks to deliver safe, growing income and long-term capital appreciation to its shareholders. Additional information on Safehold is available on its website at www.safeholdinc.com.
1114 Avenue of the Americas
New York, NY 10036
T 212.930.9400
E investors@safeholdinc.com
Company Contact:
Jason Fooks
Senior Vice President
Investor Relations & Marketing
T 212.930.9400
E investors@safeholdinc.com
1114 Avenue of the Americas
New York, NY 10036
T 212.930.9400
E investors@safeholdinc.com
| Q3 ‘22EARNINGS RESULTS |
| 2Forward-Looking Statements and Other MattersThis presentation may contain forward-looking statements. All statements other than statements of historical fact are forward-looking statements. These forward-looking statements can be identified by the use of words such as “illustrative”, “representative”, “expect”, “plan”, “will”, “estimate”, “project”, “intend”, “believe”, and other similar expressions that do not relate to historical matters. These forward-looking statements reflect the Company’s current views about future events, and are subject to numerous known and unknown risks, uncertainties, assumptions and changes in circumstances that may cause the Company’s actual results to differ significantly from those expressed in any forward-looking statement. The Company does not guarantee that the transactionsand events described will happen as described (or that they will happen at all). The following factors, among others, could cause actual results and future events to differ materially from those set forth or contemplated in the forward-looking statements: (1) the war in Ukraine and escalating geopolitical tensions as a result of Russia’s invasion of Ukraine; (2) the ability to consummate the announced transactions on the expected terms and within the anticipated time periods, or at all, which is dependent on the parties’ ability to satisfy certain closing conditions, including the approval of SAFE’s and STAR’s stockholders, completion of the Spin-Off, sales of assets and other factors; (3) anydelay or inability of New Safehold and/or SpinCo to realize the expected benefits of the transactions; (4) changes in tax laws, regulations, rates, policies or interpretations; (5) the value of New Safehold shares to be issued in the transaction; (6) the value of SpinCo's shares and liquidity in SpinCo's shares; (7) the riskof unexpected significant transaction costs and/or unknown liabilities; (8) potential litigation relating to the proposed transactions; (9) the impact of actions taken by significant stockholders; (9) the potential disruption to STAR’s or SAFE’s respective businesses of diverted management attention, and the unanticipated loss of key members of senior management or other employees, in each case as a result of the announced transactions; (10) general economic and business conditions that could affect New Safehold and SpinCo following the transactions; (11) market demand for ground lease capital; (12) the Company’s ability to source new ground lease investments; (13) the availability of funds to complete new ground lease investments; (14) risks that the rent adjustment clauses in the Company's leases will not adequately keep up with changes in market value and inflation; (15) risks associated with certain tenant and industry concentrations in our portfolio; (16) conflicts of interest and other risks associated with the Company's external management structure and its relationships with iStar and other significant investors;(17) risks associated with using debt to fund the Company’s business activities (including changes in interest rates and/or credit spreads, the ability to source financing at rates below the capitalization rates of our assets, and refinancing and interest rate risks); (18) risks that tenant rights in certain of our ground leases will limit or eliminate the Owned Residual Portfolio realizations from such properties; (19) general risks affecting the real estate industry and local real estate markets(including, without limitation, the potential inability to enter into or renew ground leases at favorable rates, including with respect to contractual rate increases or participating rent); (20) dependence on the creditworthiness of our tenants and their financial condition and operating performance; and (21) competition from other ground lease investors and risks associated with our failure to qualify for taxation as a REIT, as amended. Please refer to the section entitled “Risk Factors” in our Annual Report on Form 10-K for the year ended December 31, 2021 and any subsequent reports filed with the Securities and Exchange Commission (SEC) for further discussion of these and other investment considerations. The Company expressly disclaims any responsibility to update or revise forward-looking statements, whether as a result of new information, future events or otherwise, except as required by law.This presentation also contains modeling and information relating to potential inflation, which are presented for illustrative purposes only, and are not guarantees or otherwise necessarily indicative of future performance. In addition, this presentation contains certain figures, projections andcalculations based in part on management’s underlying assumptions. Management believes these assumptions are reasonable; however, other reasonable assumptionscould provide differing outputs.Important Note re COVID-19: Readers of this presentation are cautioned that, due to the possibility that the COVID-19 pandemic will have a delayed adverse impact on our financial results, along with the uncertainty created by the pandemic, our results for the period may not be indicative of future results. Similarly, our Rent Coverage and Unrealized Capital Appreciation as of September 30, 2022 may to decline with respect to certain properties in future periods due to the continuing impact of the pandemic and the fact that certain metrics that we report and monitor may not reflect the full effects of the pandemic as of their dates of determination. Readers are urged to read our Quarterly Report on Form 10-Q for the quarter ended September 30, 2022 when it is filed with the SEC for a more fulsome discussion of our quarterly results, including the "Management's Discussion and Analysis of Financial Condition and Results of Operations" section included therein. Note: Please refer to the Glossary at the end of this presentation for a list of defined terms and metrics. Everything as of 9/30/22 unless otherwise noted. |

| 3Forward-Looking Statements and Other MattersInflation Adjusted Yield / CPI Adjustments: Safehold™originated ground leases typically include a periodic rent increase based on prior years cumulative CPI growth with the initial lookback year generally starting between lease year 11 and 21. These CPI lookbacks are generally capped between 3.0% -3.5% per annum compounded. In the event cumulative inflation growth for the lookback period exceeds the cap, the excess is not captured by the CPI lookback. Other forms of inflation capture include fair market value resets and percentage rent, typically for acquired ground leases. 84% of our portfolio as determined by cash rent has some form of a CPI lookback and 95% of our portfolio as determined by cash rent has some form of inflation capture. For Inflation Adjusted Yield calculation assumes current FRED 30-yr Breakeven Inflation Rate of 2.27% annually. (Federal Reserve Bank of St. Louis, 30-year Breakeven Inflation Rate, retrieved from FRED, Federal Reserve Bank of St. Louis; https://fred.stlouisfed.org/series/T30YIEM, October 31, 2022)Rent Coverage / Property NOI: The Company uses estimates of the stabilized Property NOI if it does not receive current tenant information or if the propertiesare under construction/in transition. These estimates are based on leasing activity at the property, third property appraisals and available market information, such as leasing activity at comparable properties in the relevant market.Additional Information and Where You Can Find It In connection with the proposed transactions, STAR will file with the SEC a registration statement on Form S-4 that will includea joint proxy statement of STAR and SAFE and that also will constitute a prospectus for the shares of STAR Common Stock being issued to SAFE’s stockholders in the proposed Merger. In addition, SpinCo will file with the SEC a Form 10 registration statement that will register its common shares. STAR, SAFE and SpinCo alsomay file other documents with the SEC regarding the proposed transactions. This document is not a substitute for the joint proxy statement/prospectus or Form 10 registration statement or any other document which STAR, SAFE and SpinCo may file with the SEC. INVESTORS AND SECURITY HOLDERS OF STAR AND SAFE, AS APPLICABLE, ARE URGED TO READ THE JOINT PROXY STATEMENT/PROSPECTUS, THE FORM 10 REGISTRATION STATEMENT AND ANY OTHER RELEVANT DOCUMENTS THAT ARE FILED OR WILLBE FILED WITH THE SEC, AS WELL AS ANY AMENDMENTS OR SUPPLEMENTS TO THESE DOCUMENTS, CAREFULLY AND IN THEIR ENTIRETY BECAUSE THEY CONTAIN OR WILL CONTAIN IMPORTANT INFORMATION ABOUT THE PROPOSED TRANSACTIONS AND RELATED MATTERS. Investors and security holders may obtain free copies of the joint proxy statement/prospectus and the Form 10 registration statement (when available) and other documents filed with the SEC by STAR, SAFE and SpinCo through the web site maintained by the SEC at www.sec.gov or by contacting the investor relations departmentsofSTAR or SAFE at the following:This document is for informational purposes only and shall not constitute an offer to sell or the solicitation of an offer tobuy any securities, nor shall there be any sale of securities in any jurisdiction in which such offer, solicitation or sale would be unlawful prior to the registration or qualification under the securities laws of any such jurisdiction. This document is not a substitute for the prospectus or any other document that STAR, SAFE or SpinCo may filewith the SEC in connection with the proposed transactions. No offering of securities shall be made, except by means of a prospectus meeting the requirements of Section 10 of the Securities Act of 1933, as amended.Participants in the Solicitation STAR, SAFE and their respective directors and executive officers may be deemed to be participants in the solicitation of proxiesin respect of the proposed transactions. Information regarding STAR’s directors and executive officers, including a description of their direct interests, by security holdings or otherwise, is contained in STAR’s definitive proxy statement for its 2022 annual meeting, which is on file with the SEC. Information regardingSAFE’s directors and executive officers, including a description of their direct interests, by security holdings or otherwise, is contained in SAFE’s definitive proxy statement for its 2022 annual meeting, which is filed with the SEC. A more complete description will be included in the registration statement on Form S-4, the joint proxy statement/prospectus and the Form 10 registration statement.iStar,Inc.1114AvenueoftheAmericas 39thFloorNewYork,NY10036 Attention:InvestorRelationsSafehold,Inc.1114AvenueoftheAmericas 39thFloor NewYork,NY10036 Attention:InvestorRelationsInvestor Relations ContactJason Fooks212.930.9400investors@safeholdinc.com |
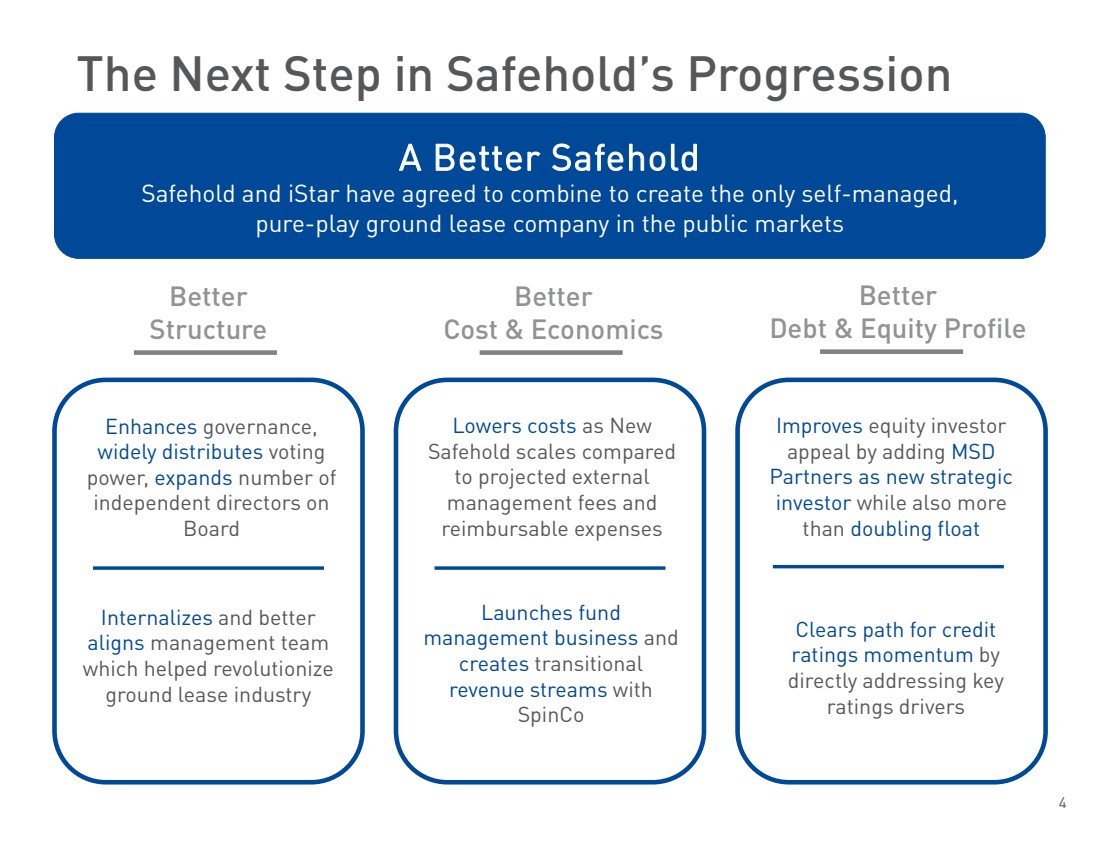
| 4The Next Step in Safehold’s Progression Internalizes and betteraligns management team which helped revolutionize ground lease industryEnhances governance, widely distributes voting power, expands number of independent directors on BoardLowers costsas New Safehold scales compared to projected external management fees and reimbursable expensesLaunches fund management business and createstransitional revenue streams with SpinCoImproves equity investor appeal by adding MSD Partners as new strategic investor while also more than doubling floatClears path for credit ratings momentum by directly addressing key ratings driversBetterStructure Better Debt & Equity Profile Better Cost & Economics A Better SafeholdSafehold and iStar have agreed to combine to create the only self-managed, pure-play ground lease company in the public markets |
| 5Q3 ’22 HighlightsSolidInvestments Strong Earnings SizableCapital Sources Note: Please see “Unrealized Capital Appreciation Details” in the Appendix for more information. (1) Investments in Q3 ’22 include $29m of new forward commitments that have not yet been funded. There can be no assurance that Safehold will fully fund these transactions.(2) Based on cash & cash equivalents and the unused capacity of the new unsecured revolving credit facility as of 9/30/22, whichmay be fully drawn, subject to certain conditions.(3) MSD committed to buy 1.0% of the total authorized Caret Units with no redemption rights contingent on the closing of the business combination and subject to Safehold shareholders’ consent to certain CARET modifications. $46.4mNet Gain from Sale of a Ground Lease52%Quarterly Y/YRevenue Growth$284mNew Ground LeaseInvestments(1)$597mNet UCA Growth$756mCash & Credit Facility Availability(2)$2.0bCaret Valuation based on Most Recent Commitment(3) |

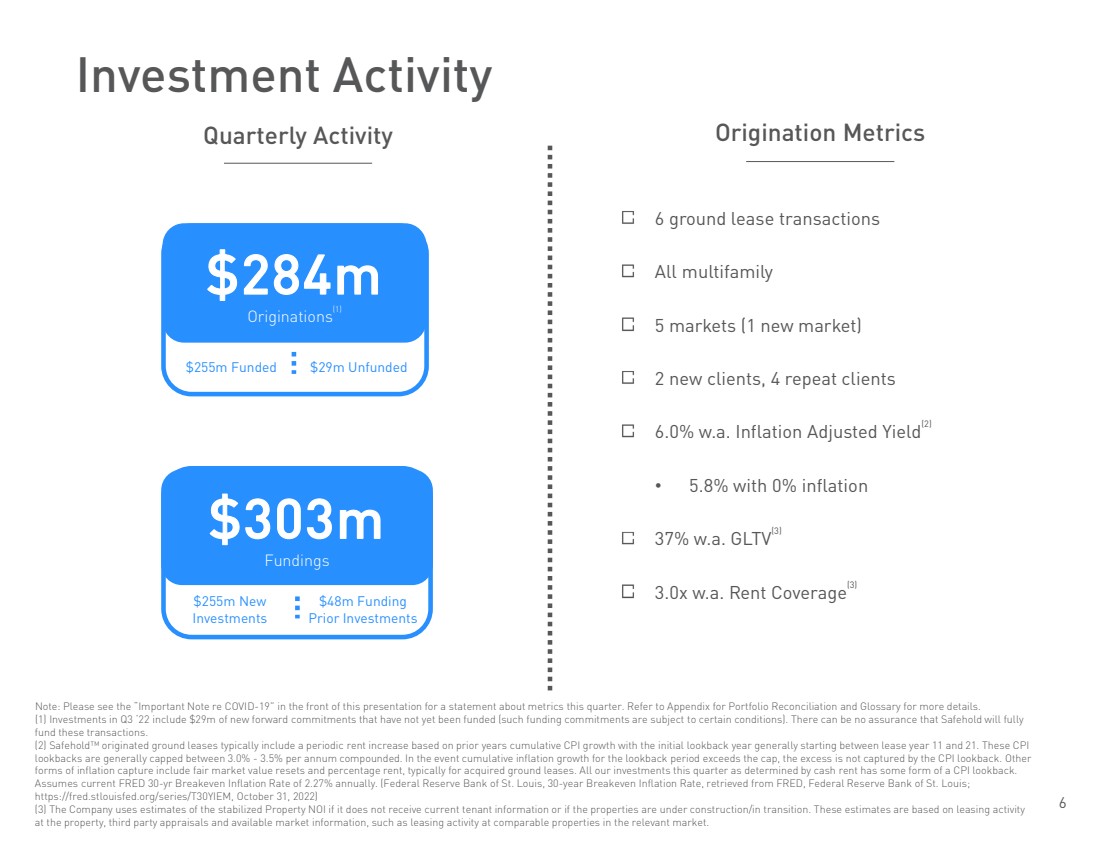
| 6 Investment Activity $284mOriginations(1) 6 ground lease transactions All multifamily 5 markets (1 new market) 2 new clients, 4 repeat clients 6.0% w.a.Inflation Adjusted Yield(2)•5.8% with 0% inflation 37% w.a.GLTV(3) 3.0x w.a.Rent Coverage(3)Note: Please see the “Important Note re COVID-19” in the front of this presentation for a statement about metrics this quarter. Refer to Appendix for Portfolio Reconciliation and Glossary for more details.(1) Investments in Q3 ‘22 include $29m of new forward commitments that have not yet been funded (such funding commitments aresubject to certain conditions). There can be no assurance that Safehold will fully fund these transactions. (2) Safehold™originated ground leases typically include a periodic rent increase based on prior years cumulative CPI growth with the initiallookback year generally starting between lease year 11 and 21. These CPI lookbacks are generally capped between 3.0% -3.5% per annum compounded. In the event cumulative inflation growth for the lookback period exceeds the cap, the excess is not captured by the CPI lookback. Other forms of inflation capture include fair market value resets and percentage rent, typically for acquired ground leases. All our investments this quarter as determined by cash rent has some form of a CPI lookback. Assumes current FRED 30-yr Breakeven Inflation Rate of 2.27% annually. (Federal Reserve Bank of St. Louis, 30-year Breakeven Inflation Rate, retrieved from FRED, Federal Reserve Bank of St. Louis; https://fred.stlouisfed.org/series/T30YIEM, October 31, 2022)(3) The Company uses estimates of the stabilized Property NOI if it does not receive current tenant information or if the properties are under construction/in transition. These estimates are based on leasing activity at the property, third party appraisals and available market information, such as leasing activity at comparable properties in the relevant market. Origination Metrics $303mFundings Quarterly Activity $255m Funded$29m Unfunded$48m Funding Prior Investments$255m New Investments |
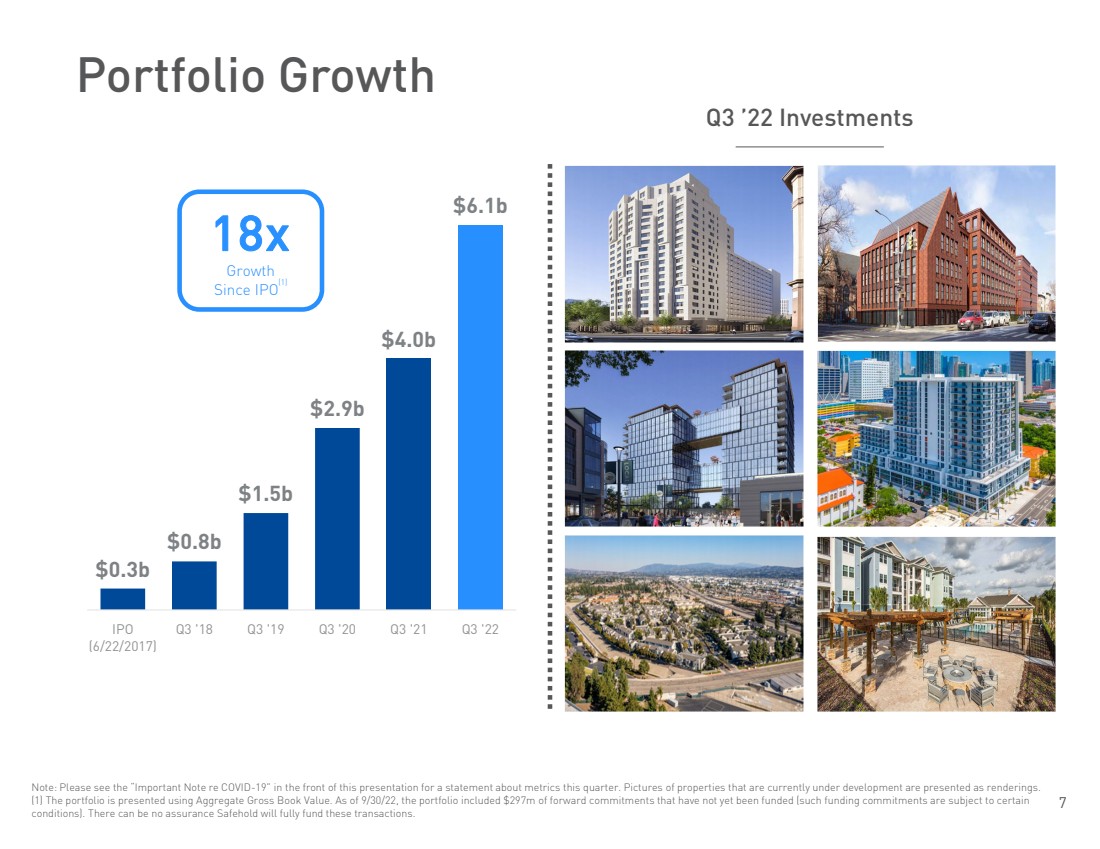
| 7 $0.3b$0.8b$1.5b$2.9b$4.0b$6.1bIPO(6/22/2017)Q3 '18Q3 '19Q3 '20Q3 '21Q3 '22Note: Please see the “Important Note re COVID-19” in the front of this presentation for a statement about metrics this quarter. Pictures of properties that are currently under development are presented as renderings. (1) The portfolio is presented using Aggregate Gross Book Value. As of 9/30/22, the portfolio included $297m of forward commitments that have not yet been funded (such funding commitments are subject to certain conditions). There can be no assurance Safehold will fully fund these transactions.Portfolio Growth 18xGrowth Since IPO(1) Q3 ’22 Investments |
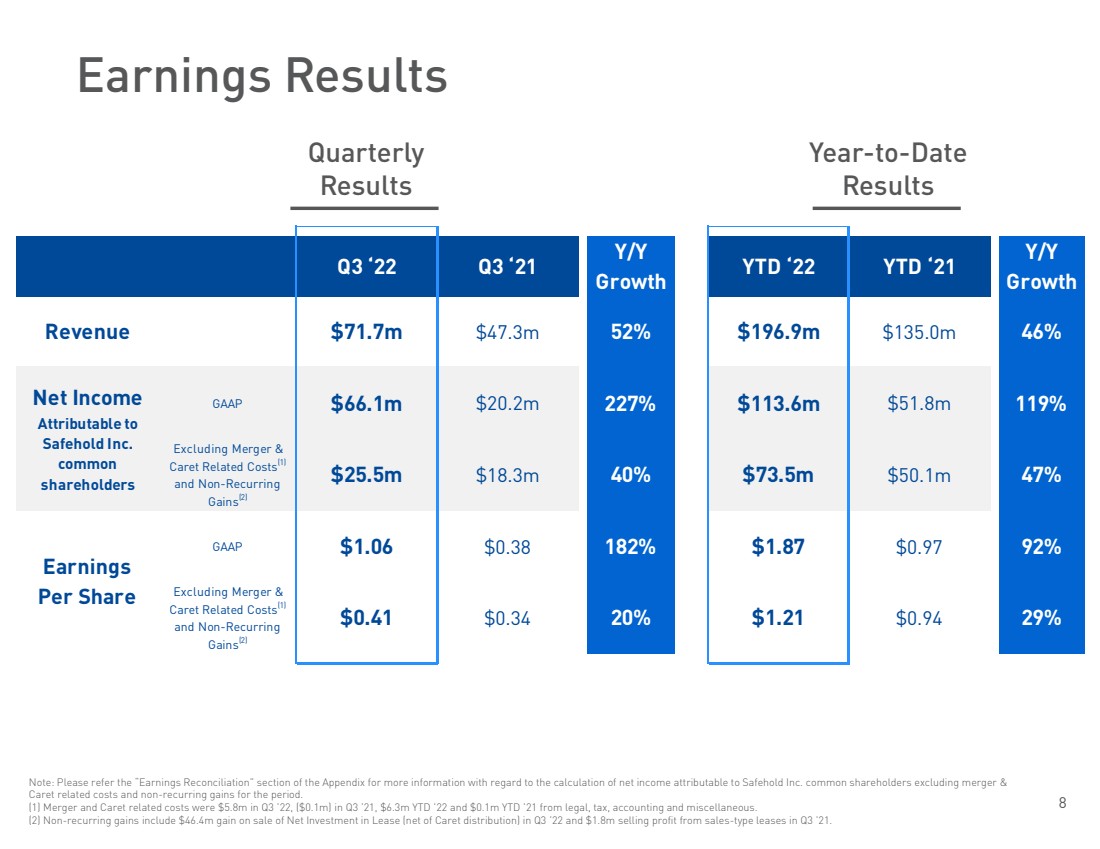
| 8Earnings ResultsQuarterlyResults Year-to-DateResults Note: Please refer the “Earnings Reconciliation” section of the Appendix for more information with regard to the calculation of net income attributable to Safehold Inc. common shareholders excluding merger & Caret related costs and non-recurring gains for the period. (1) Merger and Caret related costs were $5.8m in Q3 ’22, ($0.1m) in Q3 ’21, $6.3m YTD ’22 and $0.1m YTD ’21 from legal, tax, accounting and miscellaneous.(2) Non-recurring gains include $46.4m gain on sale of Net Investment in Lease (net of Caret distribution) in Q3 ’22 and $1.8m selling profit from sales-type leases in Q3 ’21. Q3 ‘22Q3 ‘21Y/Y GrowthYTD ‘22YTD ‘21Y/Y GrowthRevenue$71.7m$47.3m52%$196.9m$135.0m46%GAAP$66.1m$20.2m227%$113.6m$51.8m119%Excluding Merger & Caret Related Costs(1) and Non-Recurring Gains(2)$25.5m$18.3m40%$73.5m$50.1m47%GAAP$1.06 $0.38 182%$1.87 $0.97 92%Excluding Merger & Caret Related Costs(1) and Non-Recurring Gains(2)$0.41 $0.34 20%$1.21 $0.94 29%Net IncomeAttributable to Safehold Inc. common shareholdersEarnings Per Share |
| 9 Attractive Ground Lease Realization In Q3 ’22, Safehold sold a ground lease in the Washington D.C. MSA for $136.0m, generating a gain for Safehold of approximately $55.8m (gross of Caret allocations to third parties) Safehold originally purchased the asset in December 2020 for $76.7 million After paying closing costs, establishing reserves and returning the original cost basis to Safehold, the remaining $55.8m proceeds will be distributed approximately $46.8m to Safehold and approximately $9.0m to the minority Caret unitholders (including management) |

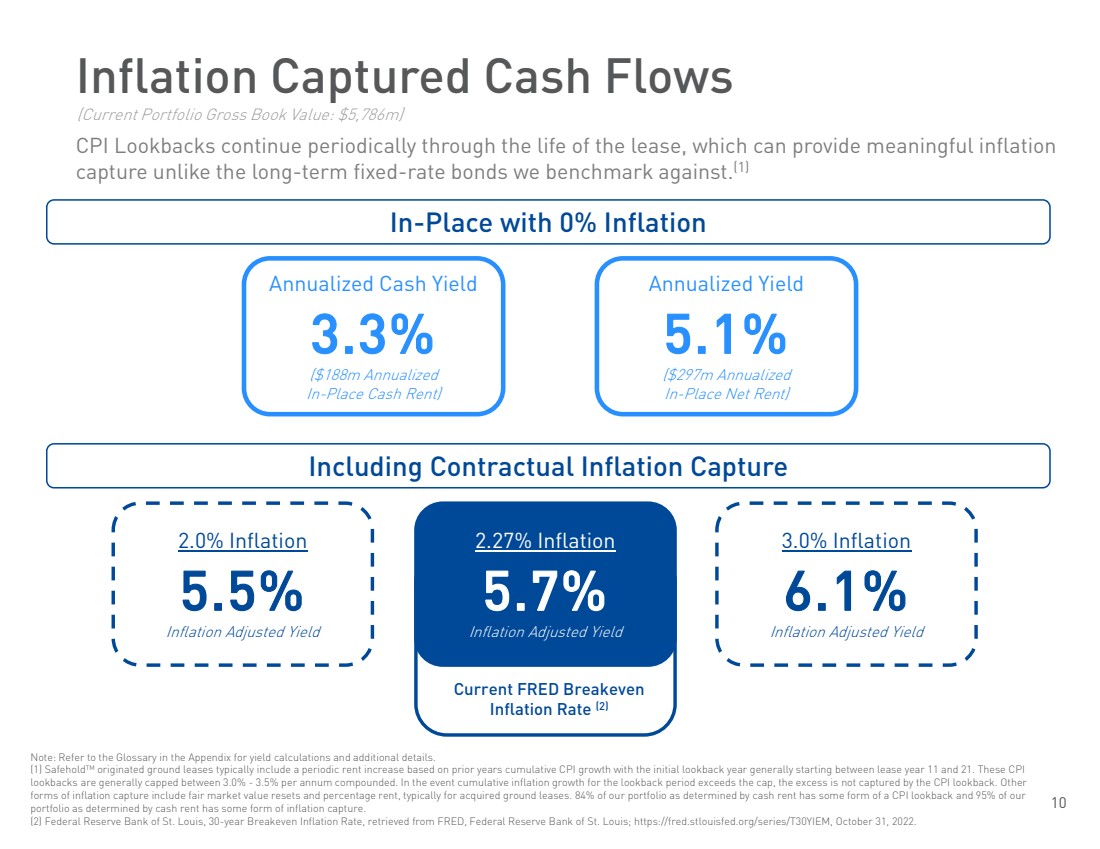
| 10 Inflation Captured Cash FlowsNote: Refer to the Glossary in the Appendix for yield calculations and additional details. (1) Safehold™originated ground leases typically include a periodic rent increase based on prior years cumulative CPI growth with the initiallookback year generally starting between lease year 11 and 21. These CPI lookbacks are generally capped between 3.0% -3.5% per annum compounded. In the event cumulative inflation growth for the lookback period exceeds the cap, the excess is not captured by the CPI lookback. Other forms of inflation capture include fair market value resets and percentage rent, typically for acquired ground leases. 84% ofour portfolio as determined by cash rent has some form of a CPI lookback and 95% of our portfolio as determined by cash rent has some form of inflation capture. (2) Federal Reserve Bank of St. Louis, 30-year Breakeven Inflation Rate, retrieved from FRED, Federal Reserve Bank of St. Louis;https://fred.stlouisfed.org/series/T30YIEM, October 31, 2022.CPI Lookbacks continue periodically through the life of the lease, which can provide meaningful inflation capture unlike the long-term fixed-rate bonds we benchmark against.(1) Annualized Yield5.1%($297m Annualized In-Place Net Rent) Annualized Cash Yield3.3%($188m Annualized In-Place Cash Rent) 2.0% Inflation 5.5%Inflation Adjusted Yield 2.27% Inflation 5.7%Inflation Adjusted Yield 3.0% Inflation 6.1%Inflation Adjusted Yield In-Place with 0% Inflation Including Contractual Inflation CaptureCurrent FRED Breakeven Inflation Rate (2)(Current Portfolio Gross Book Value: $5,786m) |
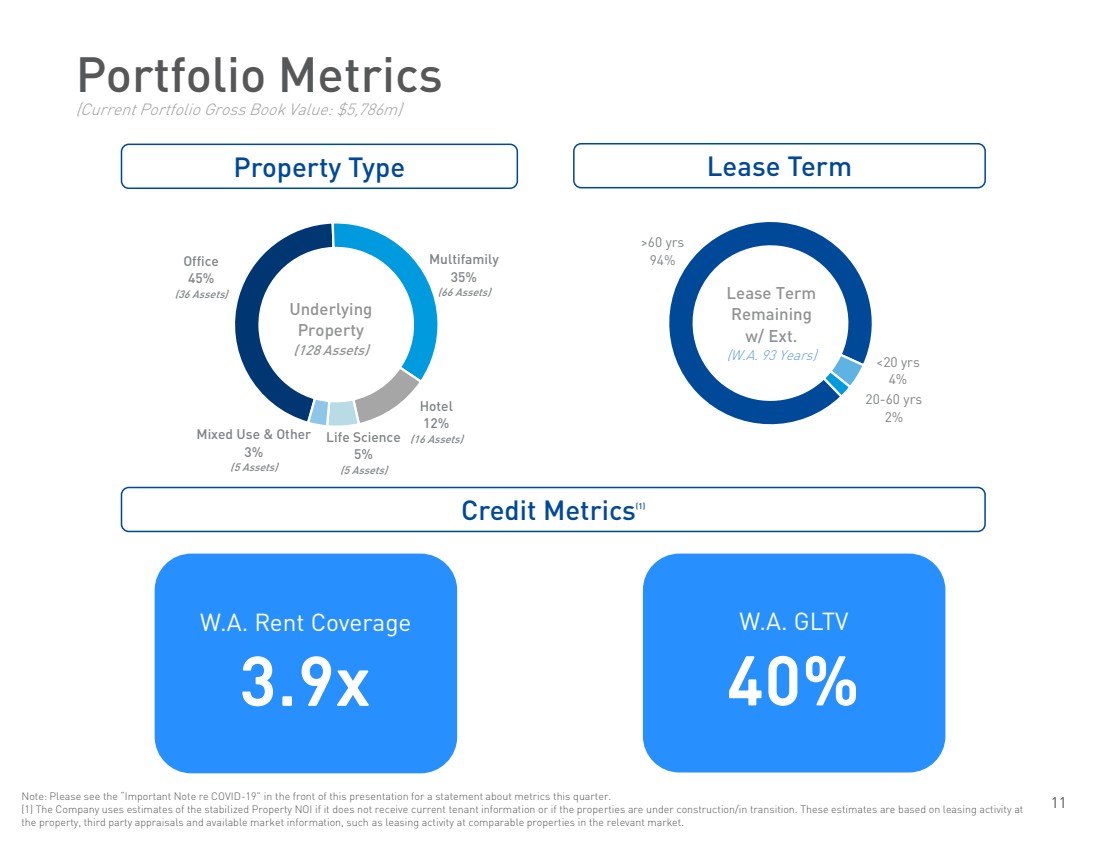
| 11 Office45%(36 Assets)Multifamily35%(66 Assets)Hotel12%(16 Assets)Life Science5%(5 Assets)Mixed Use & Other3%(5 Assets)Underlying Property(128 Assets)Portfolio Metrics(Current Portfolio Gross Book Value: $5,786m)Note: Please see the “Important Note re COVID-19” in the front of this presentation for a statement about metrics this quarter. (1) The Company uses estimates of the stabilized Property NOI if it does not receive current tenant information or if the properties are under construction/in transition. These estimates are based on leasing activity at the property, third party appraisals and available market information, such as leasing activity at comparable properties in the relevant market. Lease Term Property Type W.A. Rent Coverage3.9x W.A. GLTV40% Credit Metrics(1) >60 yrs94%<20 yrs4%20-60 yrs2%Lease Term Remaining w/ Ext.(W.A. 93 Years) |
| 12 Geographic Breakdown(Current Portfolio Gross Book Value $5,786m) Detroit Milwaukee Central3%(6 assets) Minneapolis Nashville West26%(35 assets) Southwest6%(14 assets) Southeast13%(29 assets) Northeast39%(22 assets) Mid-Atlantic13% (22 assets) Washington, D.C. Philadelphia Atlanta Raleigh-Durham Orlando Tampa Miami Sarasota Austin Dallas San Antonio Los Angeles San Francisco San Jose Portland Seattle Honolulu Salt Lake City New York Phoenix San Diego Denver Jacksonville Houston Chicago Boston Sacramento Baltimore |

| 13(1) Excludes outstanding borrowings under the Company’s unsecured revolving credit facility.(2) Based on SAFE closing share price of $29.25 on October 31, 2022.Capital Structure Interest Rates and Spreads(1)Q3 ’22Annualized Yield5.1%Effective Interest Rate3.7% Effective spread138 bpsAnnualized Cash Yield3.3%Cash Interest Rate3.2%Cash spread15 bps Debt and Liquidity MetricsQ3 ‘22Total debt$3,775m Total book equity$2,126mEquity market cap(2)$1,819mTotal debt / book equity1.8xTotal debt / equity market cap2.1xUnencumbered assets$3,265mCash & credit facility availability$756m Debt Overview Baa1Moody’s(Upgraded to Positive Outlook in Q3 ’22)($720m remaining capacity)24 year w.a.maturity(1) Credit Ratings BBB+Fitch(Stable Outlook) Pro-Rata Held by JVs$272mUnsecured Revolver$630mUnsecured Notes$1,375mNon-Recourse Secured$1,498mTotal$3.8b |

| 14 $10.5b$6.7b$5.1b$2.8b$1.6b$0.4bQ3 '22Q3 '21Q3 '20Q3 '19Q3 '18IPOEstimated Unrealized Capital Appreciation 83%CAGRSince IPO 13.2mSq. Ft. Total Square Feet: 32.7m 3.8mSq. Ft. +$597min Q3 ’22Office (1)Note: Please see the “Important Note re COVID-19” in the front of this presentation for a statement about metrics this quarter. Please see “Unrealized Capital Appreciation Details” in the Appendix for more information. (1) Square footage and total units/keys are based on information provided by the building owners, public records, broker reportsand other third-party sources and are based on the primary usage of the building. No assurance can be made to the accuracy of these figures.Hotel 14.4mSq. Ft. 0.7mSq. Ft. Life Science 0.7mSq. Ft. Mixed Use& Other(15.9k Units)(5.1k Keys)Multifamily |

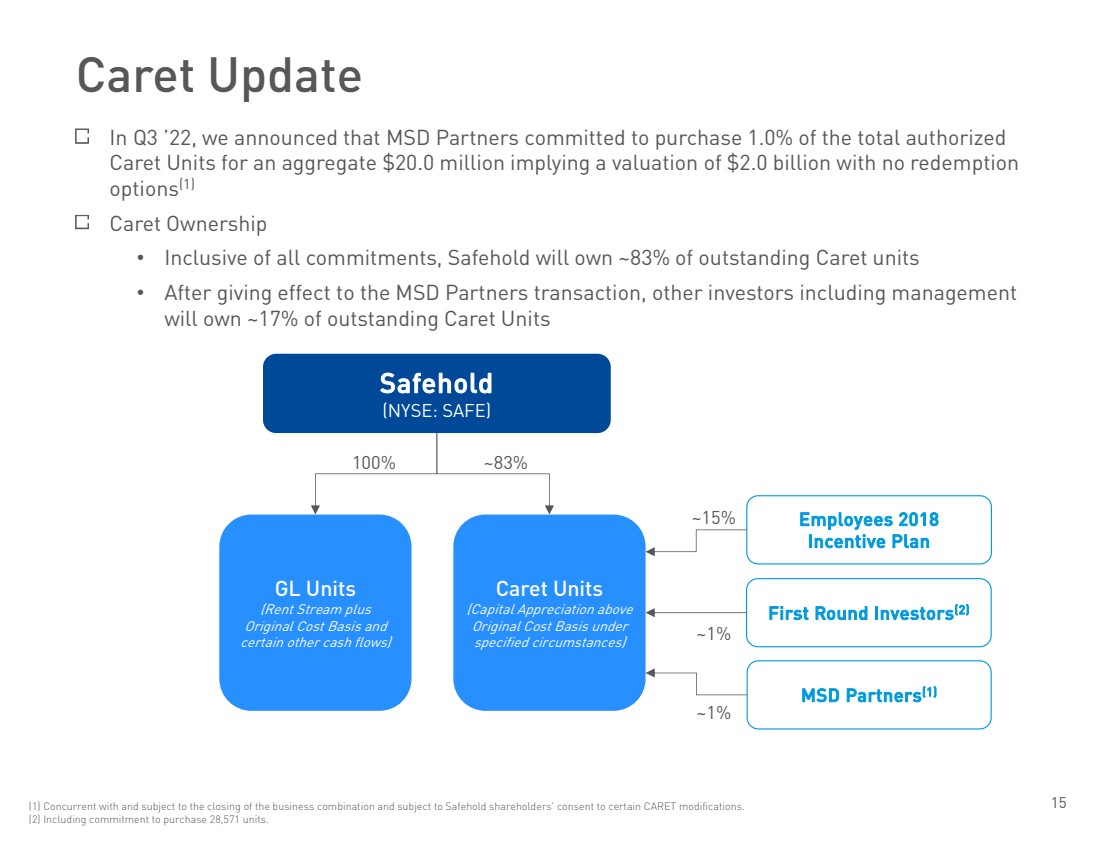
| 15Caret Update Caret Units(Capital Appreciation above Original Cost Basis under specified circumstances) Safehold(NYSE: SAFE) GL Units (Rent Stream plusOriginal Cost Basis and certain other cash flows) MSD Partners(1) Employees 2018Incentive Plan ~83%100% ~15%~1% First Round Investors(2) ~1%(1) Concurrent with and subject to the closing of the business combination and subject to Safehold shareholders’ consent to certain CARET modifications.(2) Including commitment to purchase 28,571 units. In Q3 ’22, we announced that MSD Partners committed to purchase 1.0% of the total authorized Caret Units for an aggregate $20.0 million implying a valuation of $2.0 billion with no redemption options(1) Caret Ownership•Inclusive of all commitments, Safehold will own ~83% of outstanding Caret units•After giving effect to the MSD Partners transaction, other investors including management will own ~17% of outstanding Caret Units |
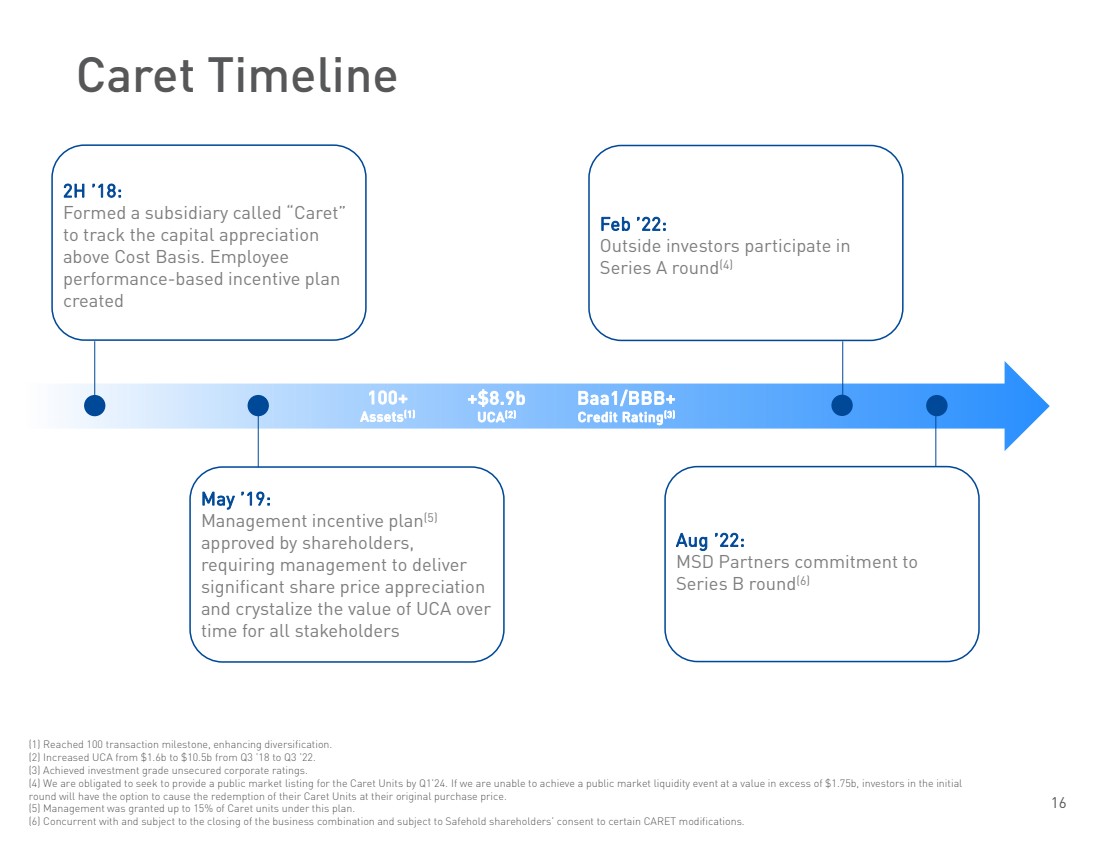
| 16Caret TimelineMay ’19:Management incentive plan(5)approved by shareholders, requiring management to deliver significant share price appreciation and crystalize the value of UCA over time for all stakeholdersFeb ’22:Outside investors participate in Series A round(4)(1) Reached 100 transaction milestone, enhancing diversification.(2) Increased UCA from $1.6b to $10.5b from Q3 ’18 to Q3 ’22.(3) Achieved investment grade unsecured corporate ratings.(4) We are obligated to seek to provide a public market listing for the Caret Units by Q1’24. If we are unable to achieve a public market liquidity event at a value in excess of $1.75b, investors in the initial round will have the option to cause the redemption of their Caret Units at their original purchase price. (5) Management was granted up to 15% of Caret units under this plan. (6) Concurrent with and subject to the closing of the business combination and subject to Safehold shareholders’ consent to certain CARET modifications. Aug ’22:MSD Partners commitment to Series B round(6) 2H ’18: Formed a subsidiary called “Caret” to track the capital appreciation above Cost Basis. Employee performance-based incentive plan created +$8.9bUCA(2)100+Assets(1)Baa1/BBB+Credit Rating(3) |
| 17 APPENDIX |

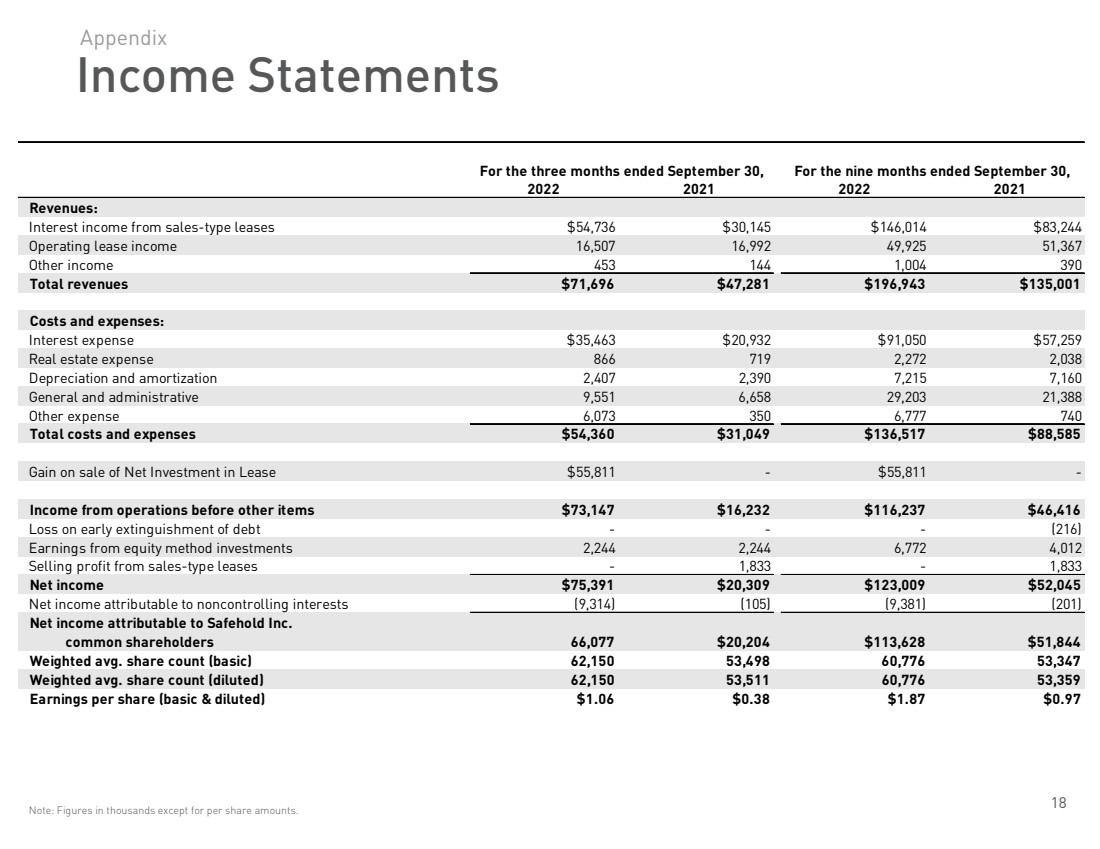
| 18Income StatementsAppendixNote: Figures in thousands except for per share amounts. 2022202120222021Revenues:Interest income from sales-t yp e leases$54,736 $30,145 $146,014 $83,244 O p eratin g lease income16,507 16,992 49,925 51,367 Other income453 144 1,004 390 Total revenues$71,696 $47,281 $196,943 $135,001 Costs and expenses:Interest ex p ense$35,463 $20,932 $91,050 $57,259 Real estate ex p ense866 719 2,272 2,038 De p reciation and amortization2,407 2,390 7,215 7,160 General and administrative9,551 6,658 29,203 21,388 Other ex p ense6,073 350 6,777 740 Total costs and expenses$54,360 $31,049 $136,517 $88,585 Gain on sale of Net Investment in Lease$55,811 -$55,811 -Income from operations before other items$73,147 $16,232 $116,237 $46,416 Loss on earl y extin g uishment of debt---(216)Earnin g s from e q uit y method investments2,244 2,244 6,772 4,012 Sellin g p rofit from sales-t yp e leases-1,833 -1,833 Net income$75,391 $20,309 $123,009 $52,045 Net income attributable to noncontrollin g interests(9,314)(105)(9,381)(201)Net income attributable to Safehold Inc. common shareholders 66,077 $20,204 $113,628 $51,844 Weighted avg. share count (basic)62,150 53,498 60,776 53,347 Weighted avg. share count (diluted)62,150 53,511 60,776 53,359 Earnings per share (basic & diluted)$1.06 $0.38 $1.87 $0.97 For the three months ended September 30,For the nine months ended September 30, |
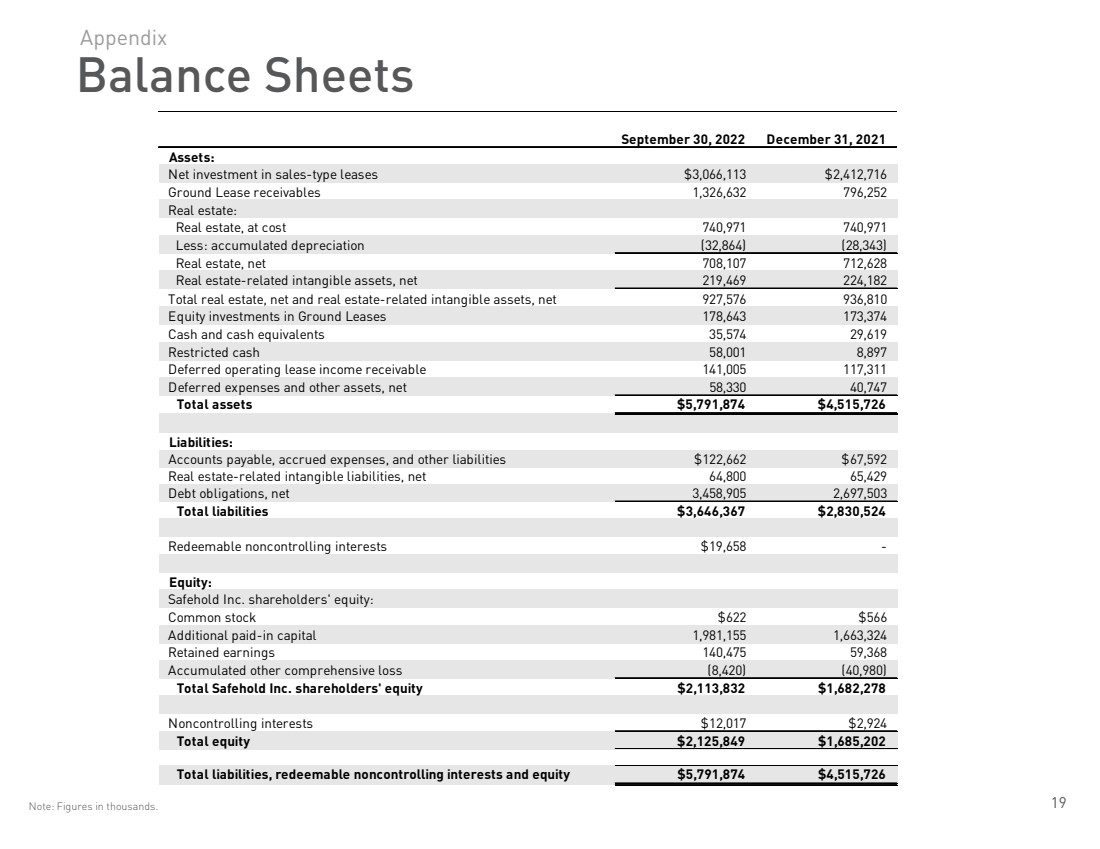
| 19Balance SheetsAppendixNote: Figures in thousands. September 30, 2022December 31, 2021Assets:Net investment in sales-t yp e leases$3,066,113 $2,412,716 Ground Lease receivables1,326,632 796,252Real estate:Real estate, at cost740,971 740,971 Less: accumulated de p reciation(32,864)(28,343)Real estate, net708,107 712,628 Real estate-related intan g ible assets, net219,469 224,182 Total real estate, net and real estate-related intan g ible assets, net927,576 936,810 E q uit y investments in Ground Leases178,643 173,374Cash and cash e q uivalents35,574 29,619 Restricted cash58,001 8,897Deferred o p eratin g lease income receivable141,005117,311Deferred ex p enses and other assets, net58,33040,747Total assets$5,791,874 $4,515,726 Liabilities:Accounts p a y able, accrued ex p enses, and other liabilities$122,662 $67,592 Real estate-related intan g ible liabilities, net64,800 65,429 Debt obli g ations, net 3,458,905 2,697,503Total liabilities$3,646,367 $2,830,524 Redeemable noncontrollin g interests$19,658 - Equity:Safehold Inc. shareholders' e q uit y :Common stock$622 $566 Additional p aid-in ca p ital1,981,1551,663,324Retained earnin g s 140,475 59,368 Accumulated other com p rehensive loss (8,420) (40,980)Total Safehold Inc. shareholders' equity $2,113,832 $1,682,278 Noncontrollin g interests$12,017 $2,924 Total equity$2,125,849 $1,685,202 Total liabilities, redeemable noncontrolling interests and equity$5,791,874 $4,515,726 |
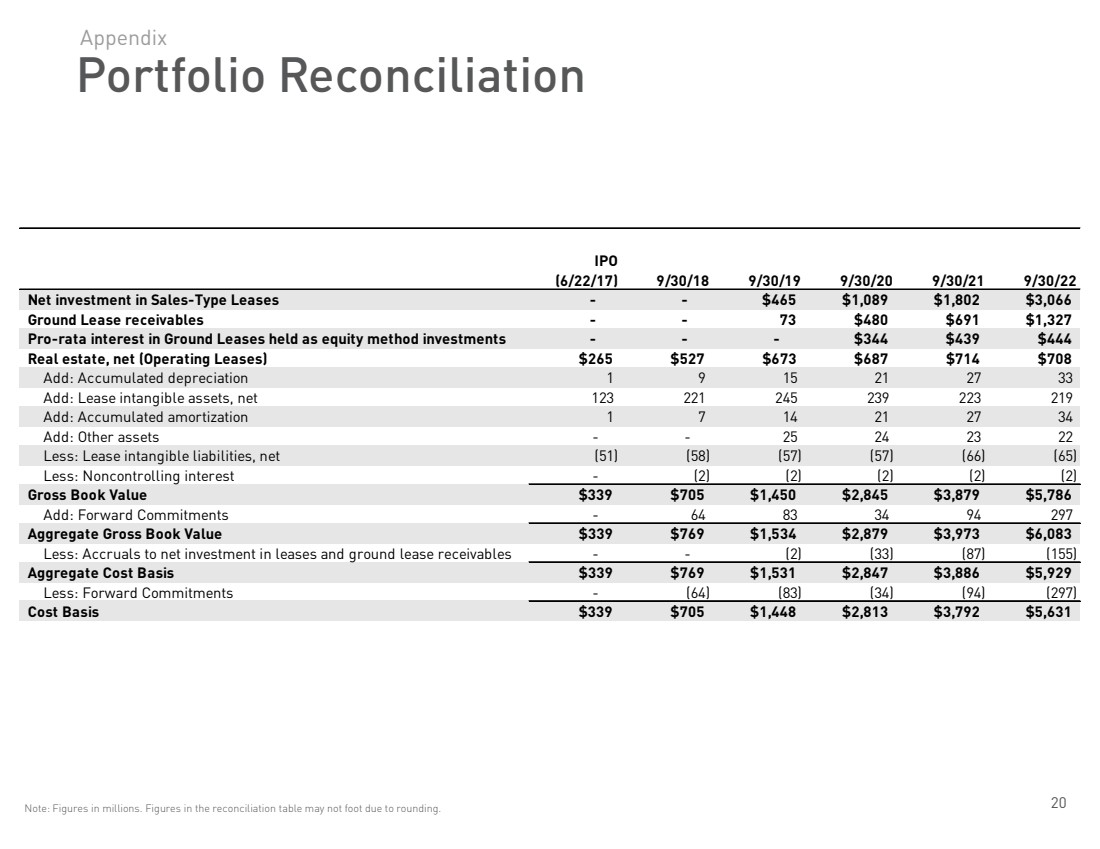
| 20Portfolio ReconciliationAppendixNote: Figures in millions. Figures in the reconciliation table may not foot due to rounding. IPO(6/22/17) 9/30/189/30/199/30/209/30/219/30/22Net investment in Sales-Type Leases- - $465$1,089$1,802$3,066Ground Lease receivables- - 73 $480$691$1,327Pro-rata interest in Ground Leases held as equity method investments- - - $344$439$444Real estate, net (Operating Leases)$265$527$673$687$714$708Add: Accumulated depreciation1 9 15 21 27 33 Add: Lease intangible assets, net123 221 245 239 223 219 Add: Accumulated amortization1 7 14 21 27 34 Add: Other assets- - 25 24 23 22 Less: Lease intangible liabilities, net(51) (58) (57) (57) (66) (65) Less: Noncontrolling interest- (2) (2) (2) (2) (2) Gross Book Value$339$705$1,450$2,845$3,879$5,786Add: Forward Commitments- 64 83 34 94 297 Aggregate Gross Book Value$339$769$1,534$2,879$3,973$6,083Less: Accruals to net investment in leases and ground lease receivables- - (2) (33) (87) (155) Aggregate Cost Basis$339$769$1,531$2,847$3,886$5,929Less: Forward Commitments- (64) (83) (34) (94) (297) Cost Basis$339$705$1,448$2,813$3,792$5,631 |
| 21Earnings ReconciliationAppendixNote: Figures in millions except for per share amounts.Net income attributable to Safehold Inc. common shareholders excluding merger & Caret related costs and non-recurring gains for the period is a non-GAAP metric used internally as a supplemental performance measure adjusting for certain extraordinary items to give management and investors a view of net income more directly derivedfrom operating activities in the period in which they occur. Net income attributable to Safehold Inc. common shareholders excluding merger & Caret related costs and non-recurring gains for the period is calculated asnet income (loss) attributable to common shareholders, prior to the effect of non-recurring gains, and charges related to the merger and administration of Caret, all as adjusted to exclude the impact of gains and charges allocable to noncontrolling interests. It should be examined in conjunction with net income (loss) attributable to common shareholders as shown in our consolidated statements of operations. It should not be considered as an alternative to net income (loss) attributable to common shareholders (determined in accordance with generally accepted accounting principles in the United States of America (“GAAP”)). This metric may differ from the calculations of similarly-titled measures used by other companies. 2022202120222021Net income attributable to Safehold Inc. common shareholders$66,077 $20,204 $113,628 $51,844 Less: Gain on sale of Net Investment in Lease(55,811)-(55,811)-Less: Sellin g p rofit from sales-t yp e leases-(1,833)-(1,833)Add: Mer g er & Caret related costs5,995 (86)6,441 101 Net income excluding merger & Caret related costs and non-recurringgains for the period$16,262 $18,284 $64,259 $50,112 Im p act attributable to noncontrollin g interests$9,279 -$9,279 -Net income attributable to Safehold Inc. common shareholdersexcluding merger & Caret related costs and non-recurring gains for the period$25,541 $18,284 $73,538 $50,112 Wei g hted avera g e number of common shares - Basic62,150 53,498 60,776 53,347 Wei g hted avera g e number of common shares - Diluted62,150 53,511 60,776 53,359 Basic EPS excluding merger & Caret related costs and non-recurring gains for the period$0.41 $0.34 $1.21 $0.94 Diluted EPS excluding merger & Caret related costs and non-recurring gains for the period$0.41 $0.34 $1.21 $0.94 For the three months ended September 30,For the nine months ended September 30, |

| 22Unrealized Capital Appreciation DetailsAppendixRefer to the Glossary in the Appendix for a definition of Owned Residual Portfolio, Unrealized Capital Appreciation (“UCA”), and“Combined Property Value” (“CPV”). SAFE relies in part on CBRE’s appraisals of the CPV of our portfolio in calculating UCA. SAFE may utilize management’s estimate of CPV for ground lease investments recently acquired that CBRE has not yet appraised. For constructiondeals, CPV represents the cost to build inclusive of the land. CPV is a hypothetical value of the as-improved subject property, based on anassumed ownership structure different from the actual ownership structure. CPV does not take into account the in-place Ground Lease or other contractual obligations and is based on the hypothetical condition that the property is leased at market rent at stabilized levels, where applicable, as of the valuation date, without consideration of any costs to achieve stabilization through lease up and associated costs. In determining the CPV of each property, CBRE has utilized the sales comparison approach, based on sales of comparable properties, adjusted for differences, and the income capitalization approach, based on the subject property’s income-producing capabilities. The assumptions applied to determine values for these purposes vary by property type and are selected for use based on a number of factors, including information supplied by our tenants, market data and other factors. We currently intend that the CPV associated with each Ground Lease in our portfolio will be valued approximately every 12 calendar months and no less frequently than every 24 months.The calculation of the estimated UCA in our Owned Residual Portfolio is subject to a number of limitations and qualifications. We do not typically receive full financial statements prepared in accordance with U.S. GAAP for the commercial properties being operated on the landsubject to our Ground Leases. In some cases, we are prohibited by confidentiality provisions in our Ground Leases from disclosing information that we receive from our tenants to CBRE. Additionally, we do not independently investigate or verify the information supplied by our tenants, but rather assume the accuracy and completeness of such information and the appropriateness of the accounting methodology or principles, assumptions, estimates and judgments made by our tenants in providing the information to us. Our calculation of UCA in our Owned Residual Portfolio is not subject to U.S. GAAP and will not be subject to independent audit. We conduct rolling property valuations; therefore, our estimated UCA and CPV may not reflect current market conditions and may decline materially in the future. There can be no assurance that we will realize any incremental value from the UCA in our Owned Residual Portfolio or that the market price of our common stock will reflect any value attributable thereto. We will generally not be able to realize value from UCA through near term transactions, as properties are leased to tenants pursuant to long-term leases. For more information on UCA, including additional limitations and qualifications, please refer to our Current Report on Form 8-K filed with the SEC on November 1, 2022 and “Risk Factors” in our Annual Report on Form 10-K for the year ended December 31, 2021, as updated from time to time in our subsequent periodic reports, filed with the SEC.We formed a subsidiary called Caret Ventures LLC that is structured to track and capture UCA to the extent UCA is realized upon sale of our land and Ground Leases or certain other specified events. Under a shareholder-approved plan, management was granted up to 15% ofthe total authorized Caret units, some of which remains subject to time-based vesting. See our 2021 proxy statement for additional information on the long-term incentive plan.We announced on February 15, 2022 that we sold 108,571 Caret units and received a commitment for the sale of 28,571 Caret units for an aggregate $24.0 million. Those 137,142 Caret units equal 1.37% of the authorized Caret units in Caret Ventures LLC, implying a total Caret unit valuation of $1.75 billion. As part of the sale, we are obligated to seek to provide a public market listing for the Caret units, or securities into which they may be exchanged, within two years. If we are unable to provide public market liquidity within the two years at a value in excess of the new investors’ basis, the investors have the right to cause us to redeem their Caret units at their original purchase price.Additionally, we announced on August 11, 2022 that MSD Partners, L.P. subscribed to purchase 100,000 Caret units from SAFE for an aggregate purchase price of $20.0 million, conditioned on, among other things, the closing of the merger and spin-off and the implementation of certain changes to the Caret program. |

| 23Glossary Aggregate CostBasisRepresents Cost Basis plus unfunded commitments. For unfunded commitments, it represents theaggregate future amount to be paid under the commitments. AggregateGross Book ValueRepresents the Current Portfolio plus unfunded commitments. For unfunded commitments, it represents theaggregate future amount to be paid under the commitments. Annualized Cash YieldCalculated as the annualized base Cash Rent plus Percentage Rent divided by Cost Basis.Annualized YieldCalculated as the annualized base Net Rent plus Percentage Rent divided by GBV. Cash Interest RateThe current cash interest rate of debt.Cash RentRepresents base ground lease income recognized excluding straight-line rent,amortization of lease intangibles, and non-cash income from sales-type leases. Combined Property Value (CPV)Thecurrentcombined value of the land, buildings and improvements relating to a commercial property, as if there was no groundleaseon the land at the property. CPV is generally basedonindependent appraisals; however, the Company will use actual sales prices/management estimates for recently acquired and originated ground leasesfor which appraisals are not yet available. For construction projects, CPV represents the total cost associated with the acquisition, development, and construction of the project. Cost BasisRepresents the historical purchase price of an asset, including capitalized acquisition costs.Current PortfolioRepresentsthe portfolio of assets owned at the date indicated, measured using Gross Book Value. Does not include unfunded commitments. Effective Interest RateRepresents the all-in stated interest rate over the term of debt from funding through maturity based on the contractual payments owed excluding the effect of debt premium, discount and deferred financing costs.GAAP RentCurrent period revenue from operating and sales-type leases recognized under GAAP.Gross Book Value (GBV)Represents Cost Basis plus accrued interest on sales-type leases.Ground Lease-to-Value (GLTV)Calculated as the Aggregate GBV divided by CPV. Safehold uses this metric to assess risk and our seniority level in a real estate capital structure. Similar to the concept of the LTV metric used in the loan market.Ground Lease Plus Commitment (GL+)Safehold’s commitment or option to purchase ground leases from iStar or a third-party contingent on certain development and timing criteria.Inflation Adjusted YieldComputed similarly to effective yield on a bond, the Inflation Adjusted Yield is calculated using projected cash flows beginning10/1/2022 for the duration of the lease, with an initial cash outflow and a residual value equal to our cost of the land. The cash flows incorporate contractual fixedescalators and the impact of an assumed inflation scenario on variable rate escalators such as (i) CPI adjustments and CPI lookbacks, (ii) percentage of revenues the building generates and/or (iii) periodic fair market valuations of the land. For CPI adjustments and CPI lookbacks, this metric uses the assumed inflation scenario for theduration of the leases. For ground leases that have other forms of inflation capture including fair market value resets and percentage rent based on building revenue, this metric assumes fair market value and building revenue increase by the assumed inflation scenario annually.Net RentGAAP Rent less depreciation & amortization. This includes the amortization of a right of use asset recorded as real estate expense (totals $1.0m annualized). Includes our proportionate share of GAAP rent and amortization from our equity method investment.Owned Residual PortfolioRepresents the portfolioof properties under which Safehold owns a ground lease and reflects Safehold’s right to the land, property and tenant improvements at the end of the lease. The current value of the Owned Residual Portfolio is typically represented by the Combined Property Value or CPV of our portfolio. Percentage RentRepresents TTM cash percentage rent paid by the property. Property NOIRepresents the net operating income (NOI) of the building/Safehold’s ground lease tenant prior to paying ground lease rent.Rent CoverageThe ratio of Property NOI as provided by the building owner or estimated Property NOI to the annualized Cash Rent due to Safehold. The Company adjusts Property NOI for material non-recurring items and uses estimates of the stabilized Property NOI if it does not receive current tenant information and for properties under construction or transition, in each case based on leasing activity at the property and available market information, including leasing activity at comparable properties in the relevant market.Safehold™/Safehold™Ground Lease A ground lease originated and structured by Safehold.Unrealized CapitalAppreciation (UCA)Calculatedas the difference between CPV and the portfolio’s Aggregate Cost Basis. The Company tracks UCA because we believe it providesrelevant information with regard to the three key investment characteristics of our ground leases: (1) the safety of our position in a tenant’s capitalstructure; (2) the quality of the long-term cash flows generated by our portfolio rent that increases over time; and (3) increases and decreases in CPV of the portfolio that will ultimately revert to us. Appendix |
